Discover the invisible: optimise your website with Microsoft Clarity
Everyone has heard of Google Analytics at some point. It shows you who visits your website, from which region, which pages are popular, which aren’t and much more. It’s a great tool, but it can also be complex.
Lees in het Nederlands →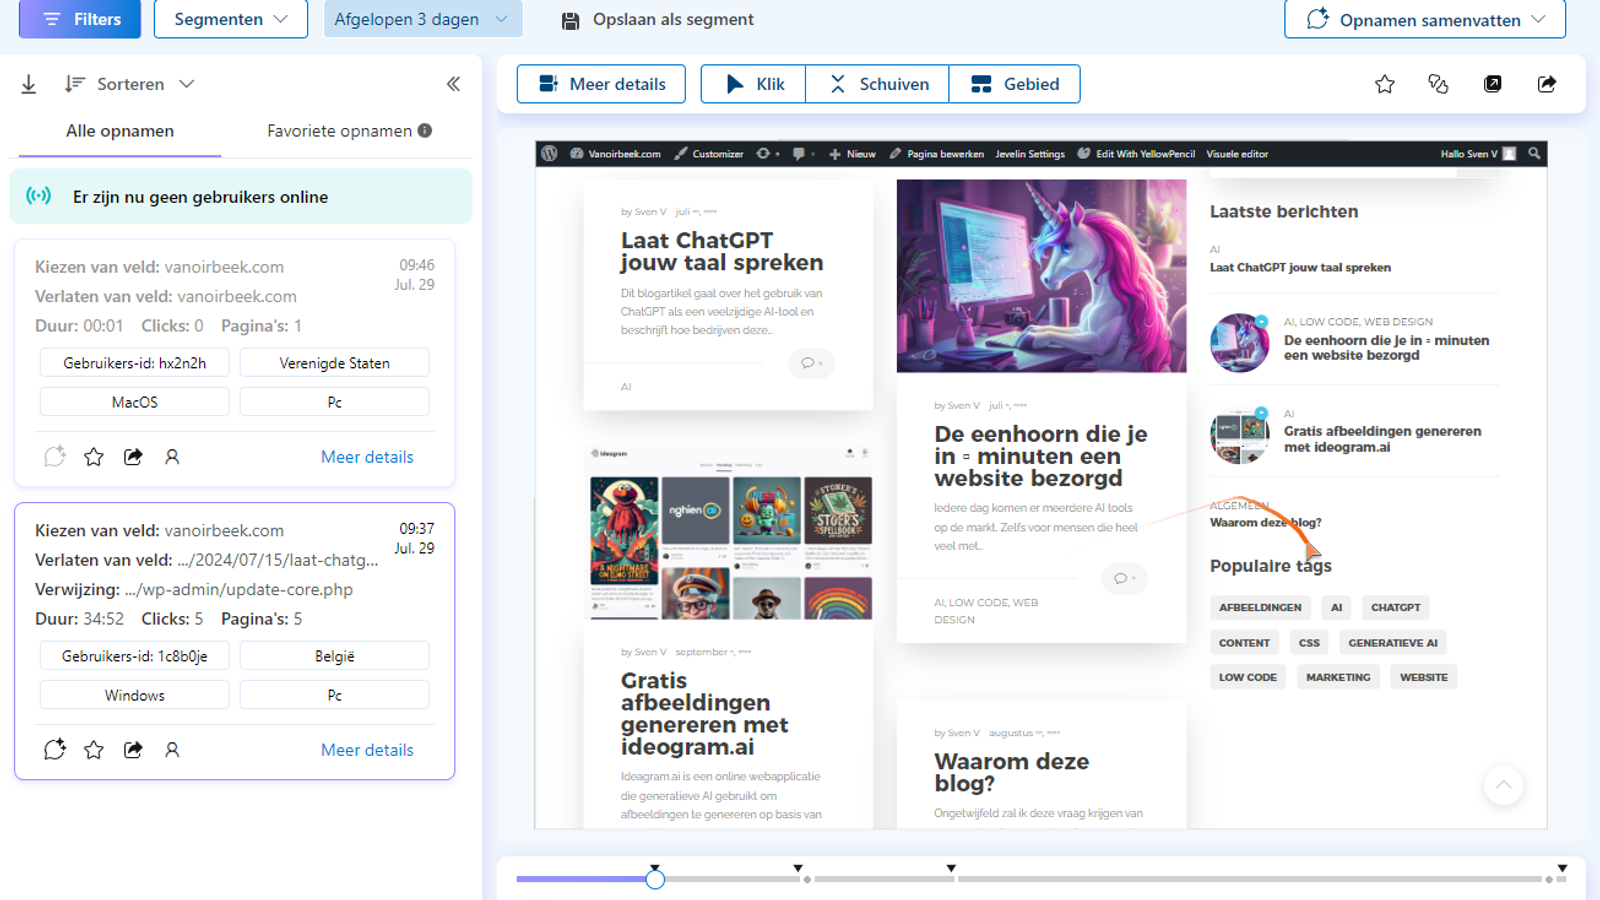
Everyone has heard of Google Analytics at some point. It shows you who visits your website, from which region, which pages are popular, which aren’t and much more. It’s a great tool, but it can also be complex. It offers a wealth of data and features that can feel overwhelming if you haven’t had the right training. The configuration can also be a bit tricky at times.
So what is Microsoft Clarity? Microsoft Clarity is a free user analytics tool that helps businesses understand how users interact with their websites. It provides detailed data and insights to help you understand user behaviour and optimise the user experience. On top of that, it’s a perfect addition to Google Analytics. In fact, the two complement each other and integrate smoothly.
In this blog, I’ll zoom in a bit more on the different features.
Easy installation
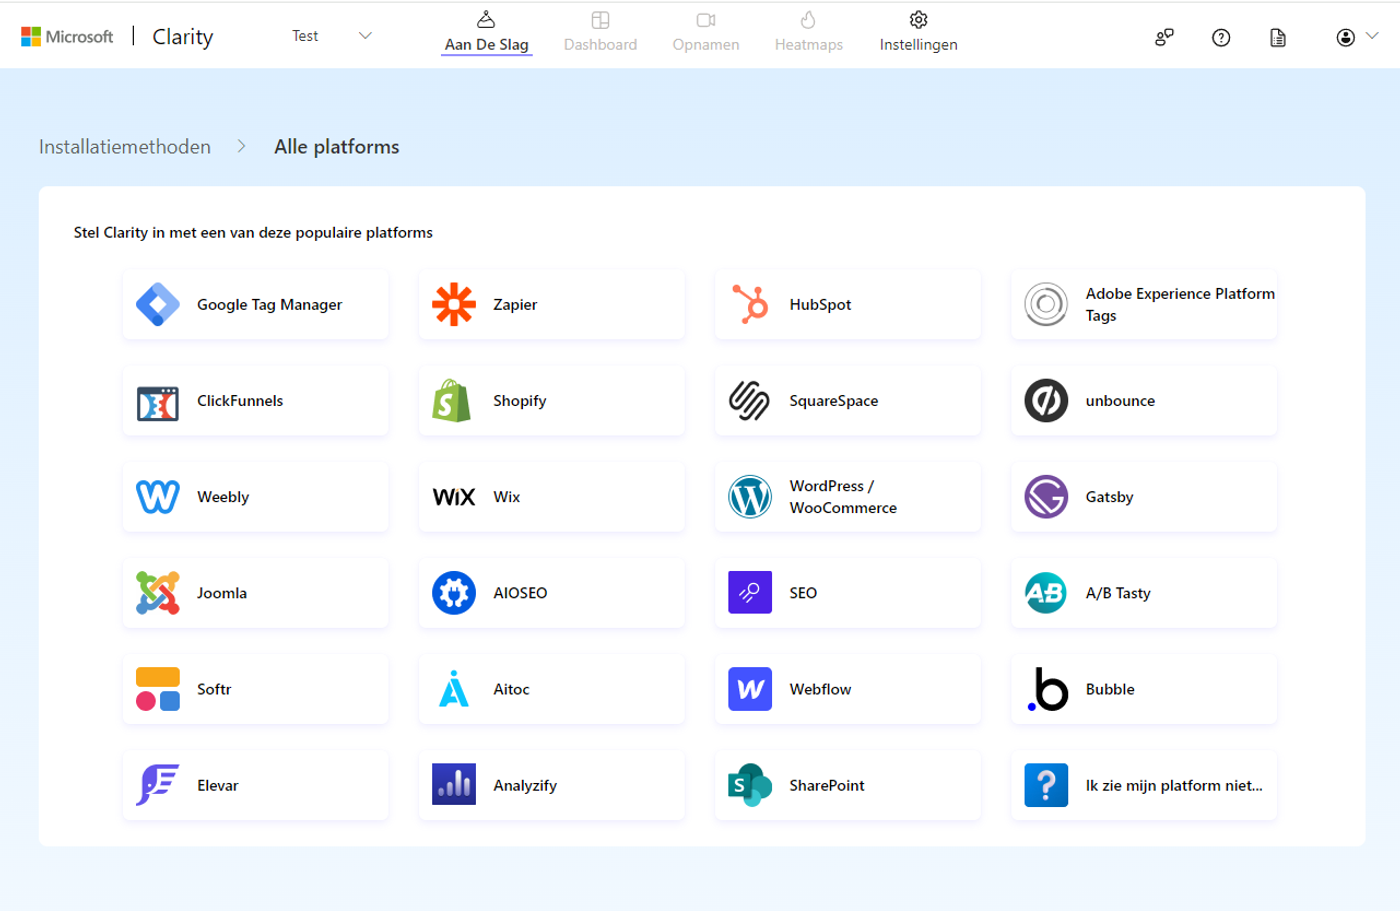
One of the biggest advantages of this tool is how easy it is to install and integrate, even if you don’t have a technical background. To get started, go to the Microsoft Clarity website and sign in with your Microsoft account. If you don’t have an account yet, you can easily create one. Once you’re signed in, you can create a new project by entering the name and URL of your website. As soon as your project has been created, you get a snippet of JavaScript code containing your tracking code. You need to add this code to the <head> section of your HTML pages.
You can also install it on well-known CMS platforms such as WordPress via a plugin. For each platform, it explains step by step what you need to do.
Insight & analysis
The dashboard gives you an overview of how users interact with your website. This includes data such as the time spent on the site, the number of pages viewed per session and the bounce rate.
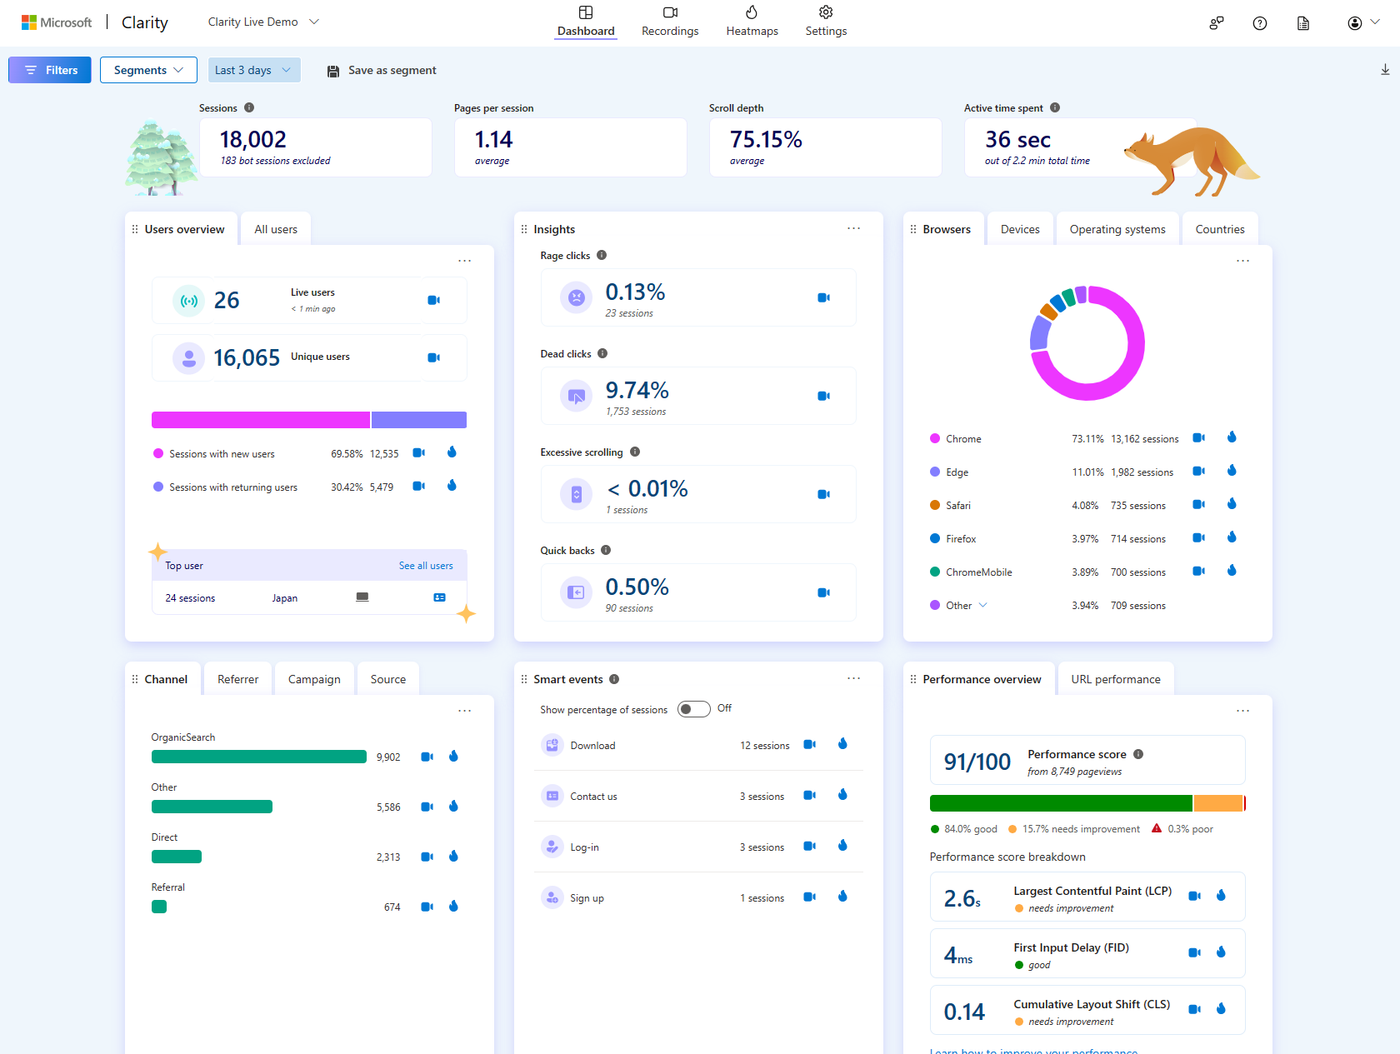
You can segment user data based on various criteria such as device type, geographic location and traffic sources. These filter options help you run targeted analyses and optimise the experience for specific user groups. This is especially useful for developing targeted marketing strategies and improving mobile experiences.
The dashboard also identifies technical issues such as JavaScript errors and slow loading times. These insights are crucial for keeping the user experience smooth. By fixing technical issues quickly, you can stop users from getting frustrated and leaving your site.
Behavioural analysis
Understanding user behaviour is essential for optimising the user experience on your website. Microsoft Clarity offers several metrics that give you insight into how users interact with your website and where the potential bottlenecks are.
Excessive Scrolling
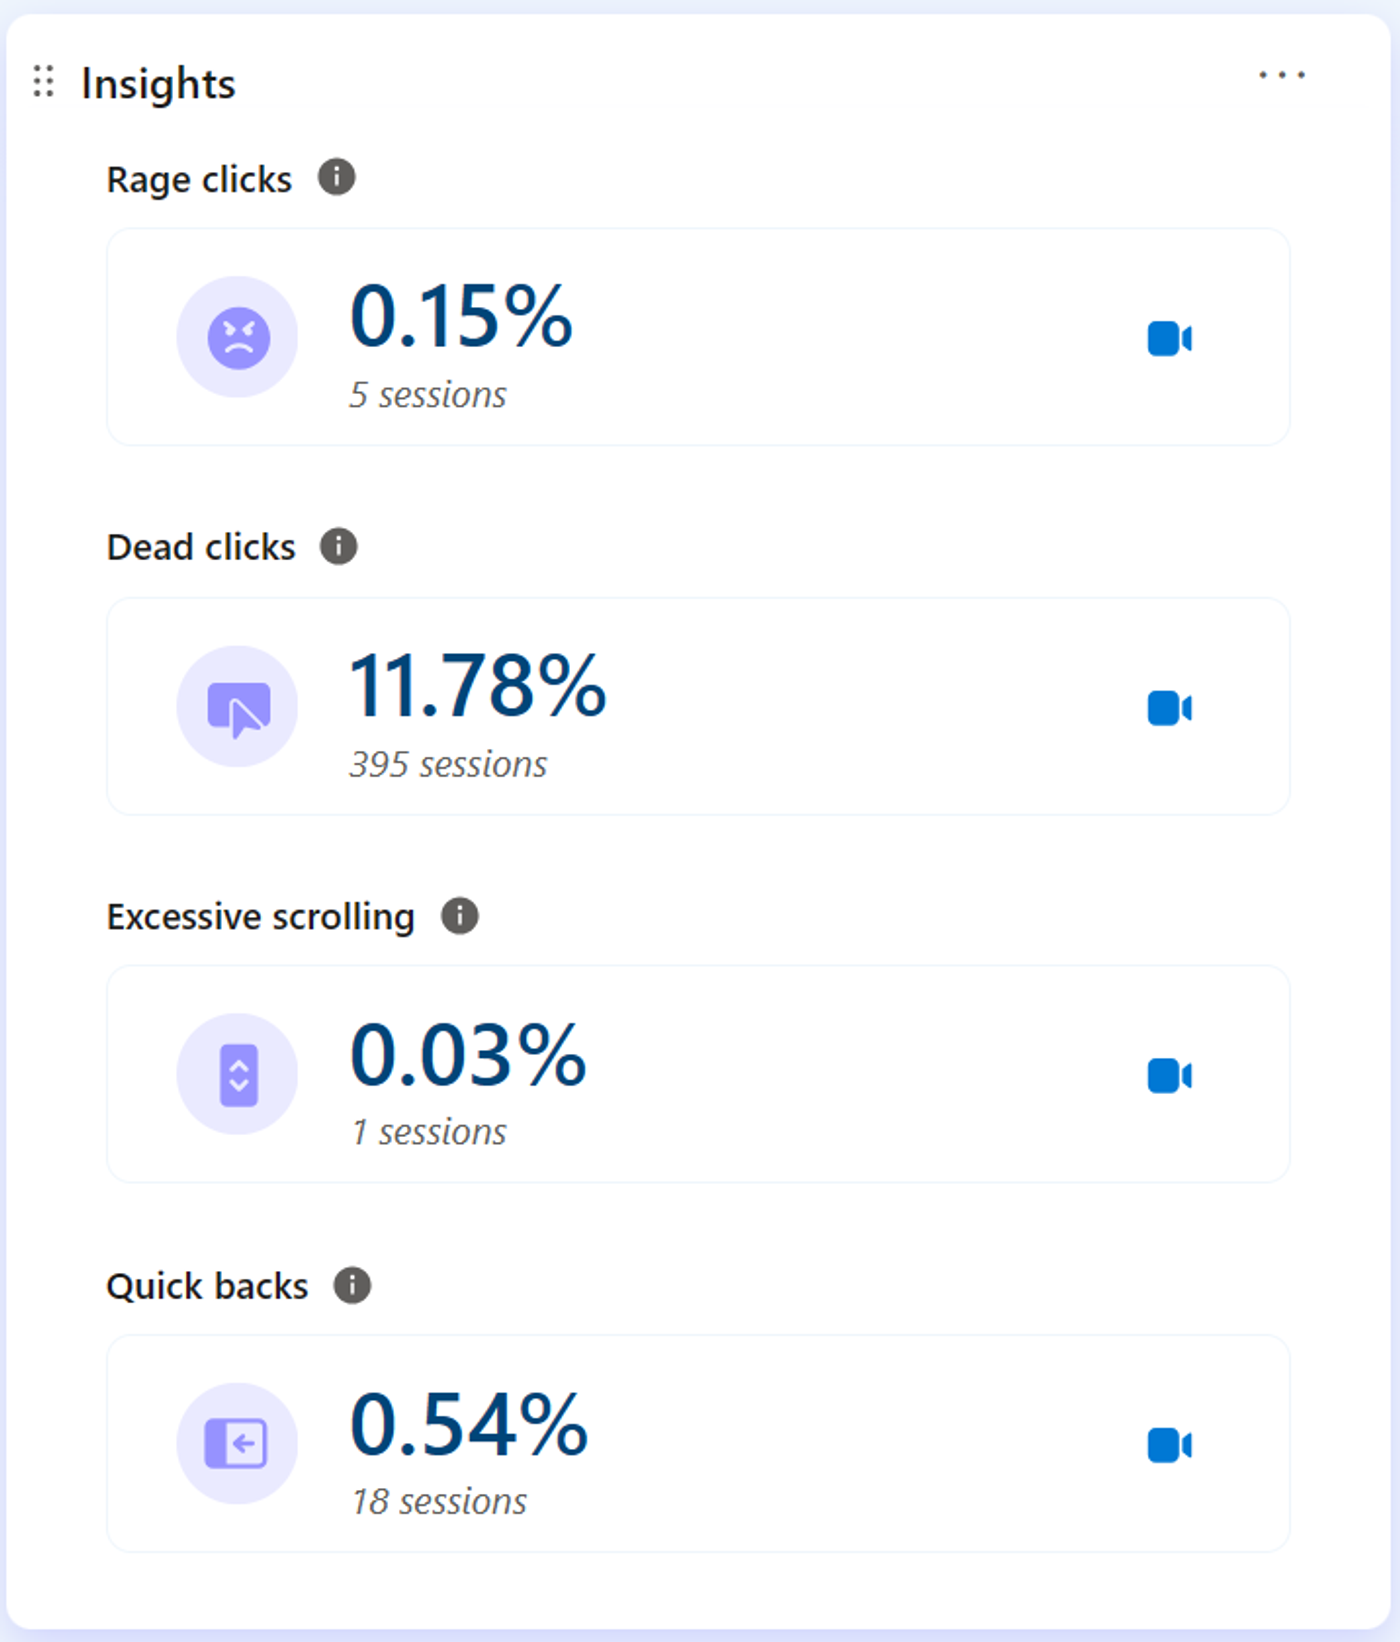
When a user session is flagged as ‘excessive scrolling’, it means there are more vertical scroll movements than average. This can point to a frustrating user experience, poor content relevance or non-standard site interactions. Excessive scrolling can be a strong indicator that a particular page is contributing to people leaving the site. By analysing this metric, you can work out which parts of your pages need to be revised to improve usability.
Rage Clicks
A session is flagged with ‘rage clicks’ when a user clicks on a specific area several times in quick succession. These rage clicks often indicate user frustration, especially when users expect an element to be interactive. Identifying rage clicks can help you pinpoint the crucial moments in a session where users get frustrated, so you can tackle those issues and improve the user experience.
Dead Clicks
‘Dead clicks’ also suggest a poor user experience. They happen when a user clicks on an element but gets no feedback within a reasonable time. In other words, the visual state doesn’t change and no navigation takes place. Dead clicks can point to broken elements, high request latency or misleading UX. Tackling dead clicks helps you fix technical issues and improve the interaction on your site.
Quick Backs
A ‘quick back’ occurs when a user quickly returns to the previous page after a click that leads to another website. It means the user didn’t find the navigation useful and came back within a certain time. Clarity detects quick backs when a user returns to the previous page faster than a defined threshold time (the dwell time for that page). This metric can be tailored to your site’s specific needs in future releases.
On top of the metrics above, Clarity offers other valuable insights:
- JavaScript errors: See the total number of JavaScript errors and a detailed breakdown per error. This helps you identify and fix technical issues.
- Click Errors: JavaScript errors that occur after a user click are flagged automatically. By filtering these sessions, you can understand what went wrong.
- Smart Events: These track important user actions on your website and give you quick access to relevant data without any code.
- Funnels: Show a series of user actions to visualise progress through each stage of the user flow. Create code-free funnels for unique scenarios.
Session recordings
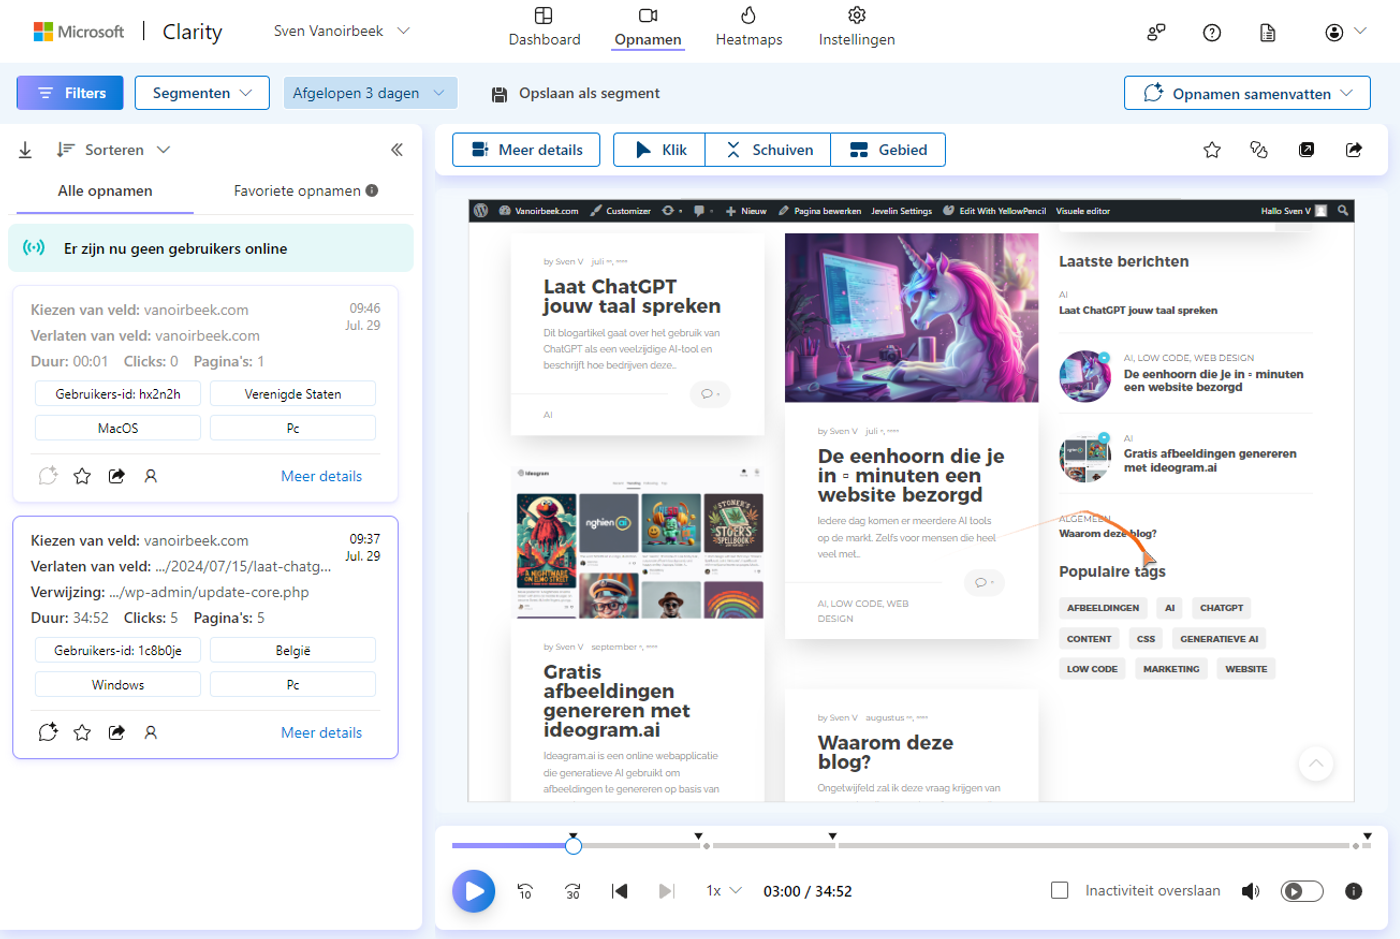
With session recordings, you can analyse user behaviour across an entire session. By replaying users’ actions, you get insight into their perspective, traffic sources, session timing and more.
Clarity tracks user activity until they’ve been inactive for 10 minutes. User inactivity is recorded for up to 30 minutes, even if the user is away from the page or screen. A session expires after 30 minutes of inactivity.
Clarity recordings capture user events such as scrolling, clicks/taps, page/screen visits, etc., and keep them for 90 days. After watching your session recordings, you can make changes to optimise your page or screen and increase conversions. Session recordings help answer important questions, such as:
- What is the visitor trying to do on your website or app?
- What content do your visitors see as essential?
- What works well for my users?
- Did your visitor miss important information, such as a CTA (call to action), by not scrolling far enough?
- Where do users get frustrated?
- What’s going wrong on your site or app?
- What could be improved on the site or app?
Heatmaps
A heatmap (or heat map) is a visualisation tool that makes it easy to analyse aggregated information about how users interact with a website. Microsoft Clarity tracks all clicks and scroll movements of visitors on mobile devices, desktops and tablets, and automatically generates a heatmap. This data helps you identify the most engaging areas and spot any gaps in the user experience.
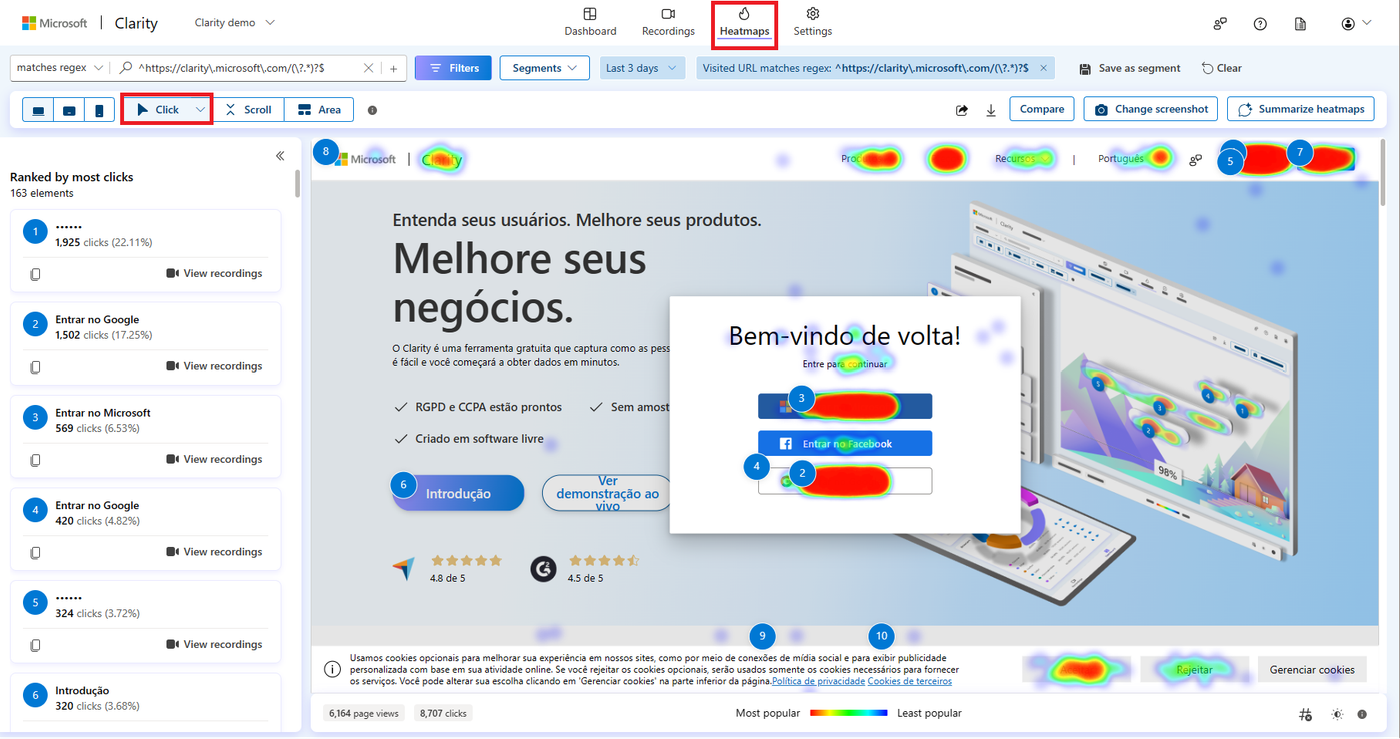
Now let’s take a look at the different types of heatmaps available in Microsoft Clarity.
Click Maps
Click maps show where users click on the page. This tells you which elements get clicked the most and how many clicks they get. Clarity click maps are built using an advanced methodology based on element-based user clicks rather than the absolute mouse position, which keeps them accurate across different screen sizes and responsive site designs.
Types of click maps:
- All clicks
- Dead clicks
- Rage clicks
- Error clicks
- First clicks
- Last clicks
Scroll Maps
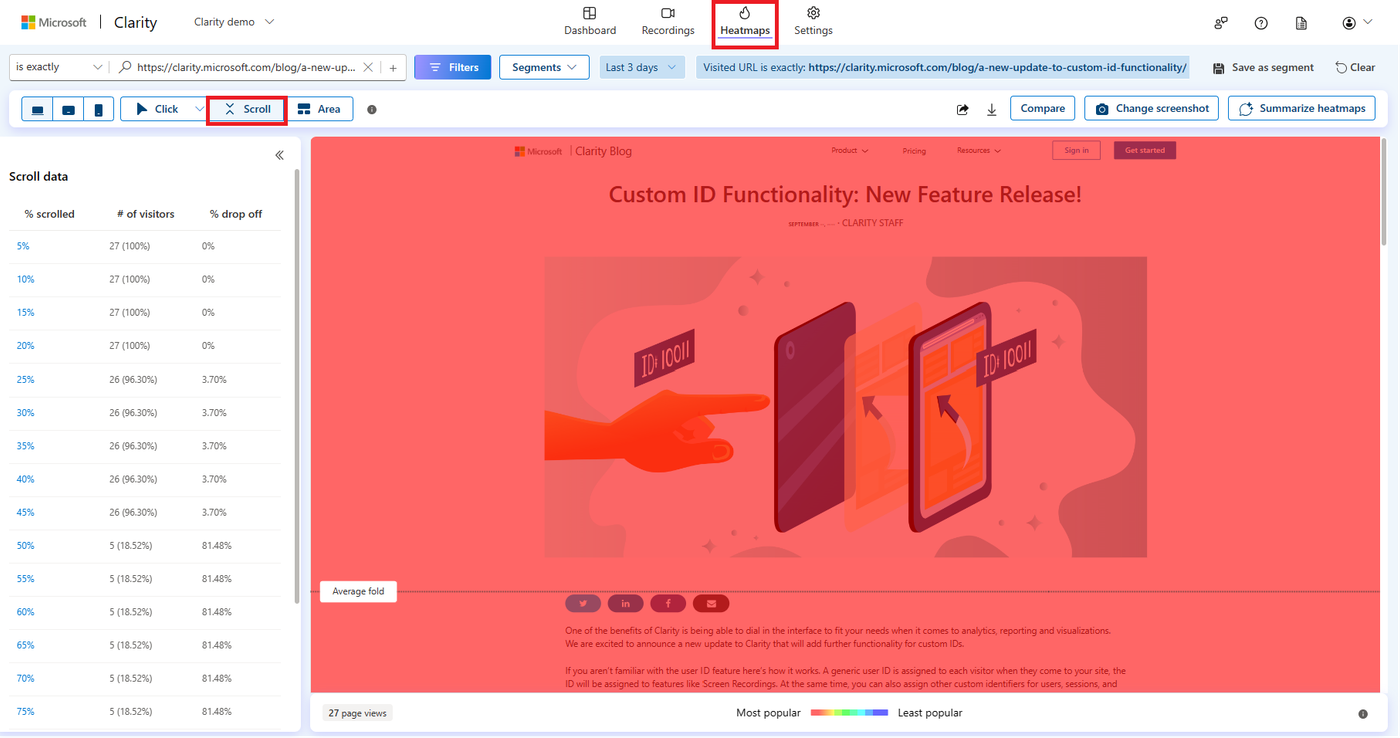
Scroll maps track how far users scroll down a page, with ‘hot’ marking popular areas and ‘cold’ less popular ones. This helps you understand what percentage of users scroll to a certain part of your web page and where the average fold is. The average fold is the part of a web page that’s visible before the user starts scrolling.
Area Maps
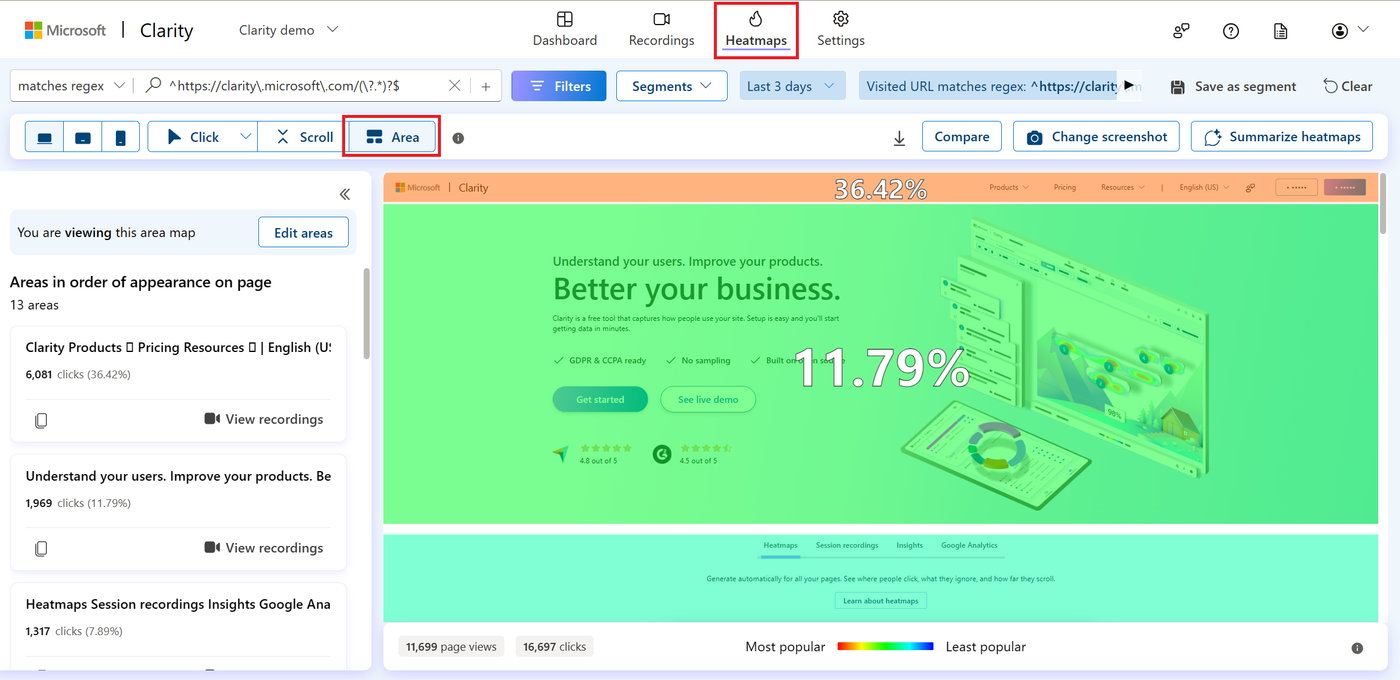
Area maps show the total number of clicks for all elements within a selected area. Unlike click maps, you can select the area yourself and view the clicks for all elements within it.
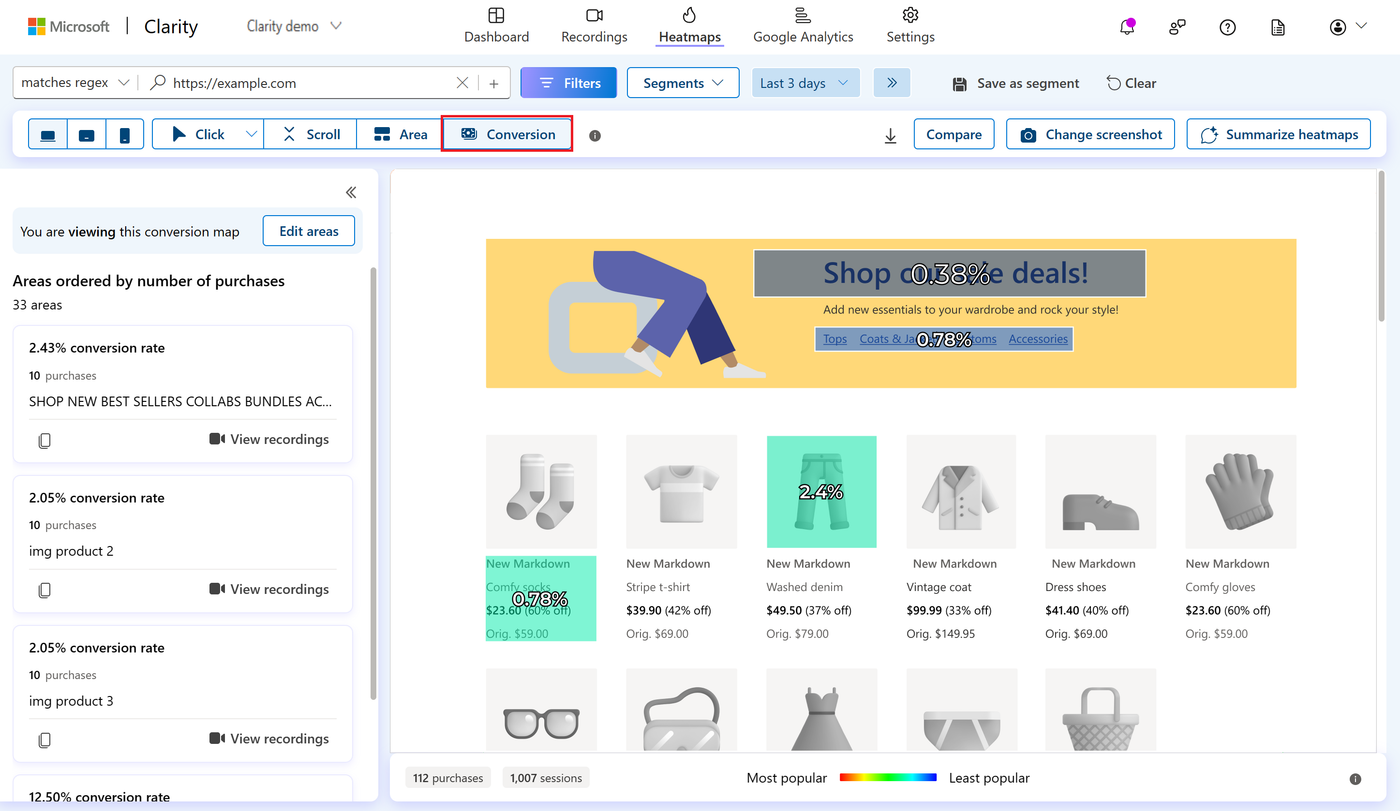
Conversion Maps
Conversion maps give you specific data on the conversion rate of your e-commerce sites. With conversion maps, you can understand how website interactions affect your business metrics.
Integration with other tools
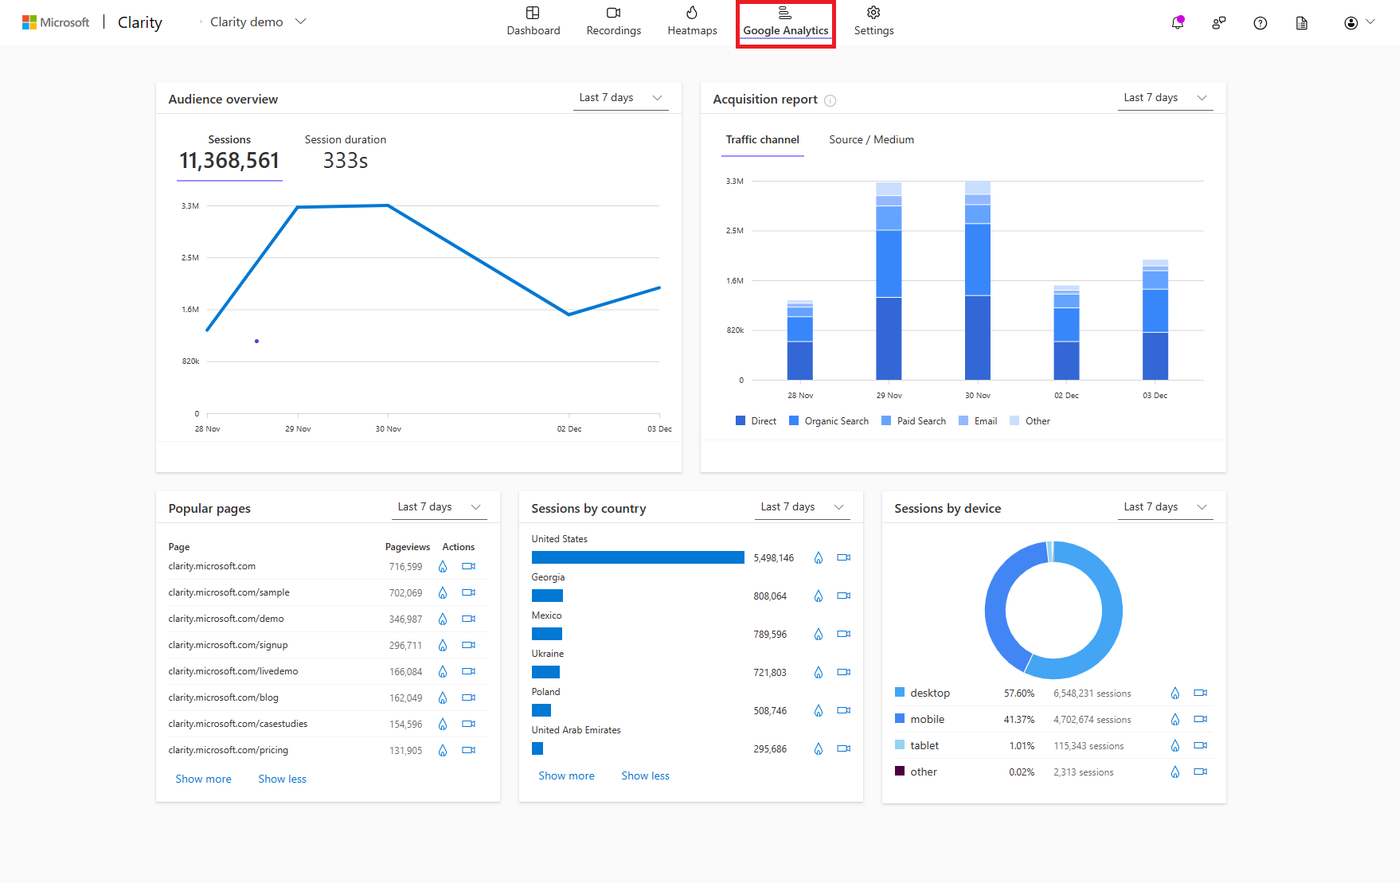
Microsoft Clarity can also be easily integrated with other platforms and tools, such as Google Analytics, to get a fuller picture of user behaviour. In the Clarity dashboard, you can link your Clarity account to Google Analytics. This gives you a comprehensive overview of user interactions and website performance, which helps you make targeted improvements.
Conclusion
Microsoft Clarity is a powerful and user-friendly tool that helps businesses and non-profits gain in-depth insight into how users behave on their website, portal or app. With features such as heatmaps, session recordings and detailed user analytics, Clarity helps organisations spot bottlenecks and opportunities. That leads to a better user experience, higher conversion rates and more engagement. Whether you want to fix technical issues, optimise content or better understand user behaviour, Microsoft Clarity gives you the insights you need to make well-informed decisions and strengthen your digital presence.
More from this zone

Anthropic goes public: what changes for your business?
Anthropic, the maker of Claude, listed on the Nasdaq on 19 November 2026 in the largest IPO ever. What does that mean for businesses using Claude: prices, data and continuity?

Claude Fable 5.2: what's new in Anthropic's most powerful model?
Anthropic launched Claude Fable 5.2 on 9 November 2026: faster, cheaper and stronger at code, research and long agent tasks. What's new, and who is it worth it for?